Today's recovery decisions shouldn't run on last week's data.
Live portfolio performance, workflows, account-level behavioral signals, compliance status, and audit documentation, continuously updated in one screen.
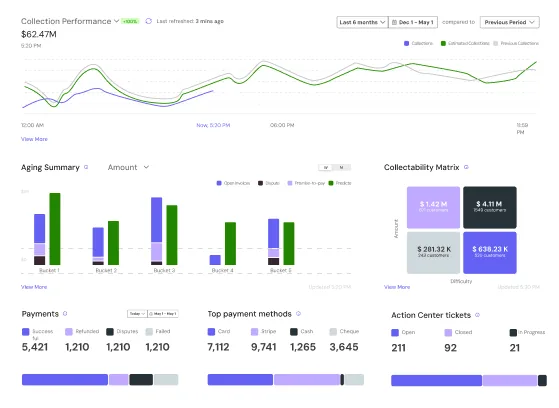
By the time the data surfaces, the damage is already done.
Most collections teams make daily decisions on weekly reports. By the time delinquency, charge-off, or compliance data surfaces, the account has already aged, the opportunity has passed, or the exposure already exists.
Lagging data, made live.
The metrics that say whether the infrastructure is working
- ✓Recovery rate by aging bucket, visible in real time
- ✓Right-party contact rate by segment, the leading indicator
- ✓Promise-to-pay kept rate, to spot plan-structure failure
- ✓Cost per recovery, the number most CFOs aren't tracking precisely
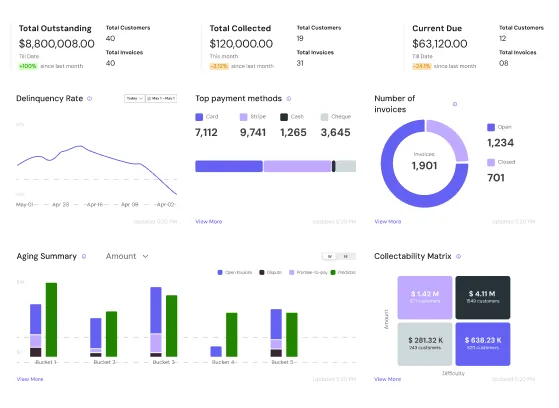
Catch the roll-forward before it reaches charge-off
- ✓Accounts showing early-stage signals surfaced before they age
- ✓Risk scoring that separates high roll-forward from likely self-cure
- ✓Declining-engagement and plan-abandonment flags
- ✓Net charge-off framed as the cumulative cost of infrastructure gaps
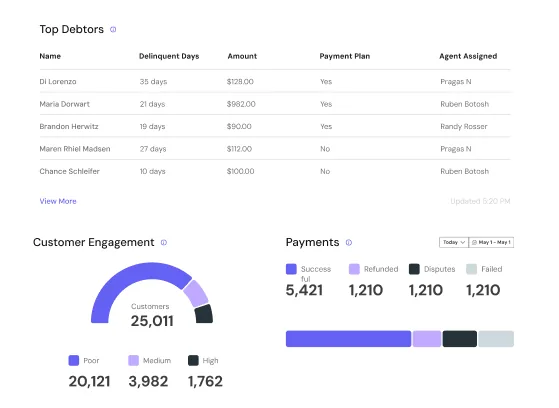
Zero surprises in a regulatory examination
- ✓Every compliance dimension visible at portfolio and account level
- ✓Formal complaint rate tracked alongside delinquency, not after a complaint arrives
- ✓Pre-send status, consent, frequency, and dispute holds in one view
- ✓Documentation exported without manual reconstruction
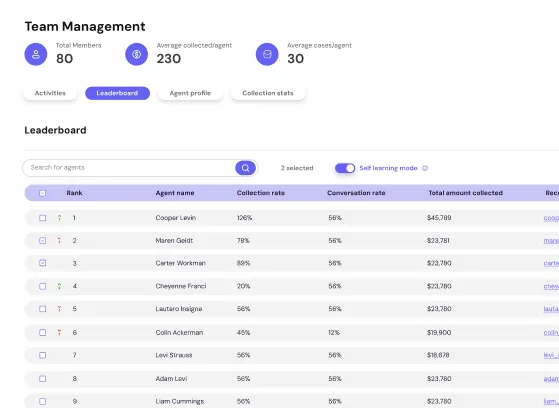
One source of truth, updated live.
Built for every leader who needs to see the portfolio clearly.
Dashboard
questions
At minimum: right-party contact rate by segment, recovery rate by aging bucket, promise-to-pay kept rate, cost per recovery trending daily, formal complaint rate, and compliance status across active interactions. The shift from weekly reporting to real-time visibility changes the operational model from reactive to predictive.
A lagging indicator, net charge-off rate, late-stage delinquency, reflects damage already done. A leading indicator, right-party contact rate, early engagement signals, portal behavior, shows what's about to happen and can be acted on. If you're managing only lagging indicators, you're always responding to problems that are already aged.
Early signals: declining engagement after the first installment, reduced channel responsiveness, missed micro-commitments in the first two weeks. The Dashboard surfaces these at the account level before the plan formally fails, enabling intervention rather than re-collections.
Timestamped records of every contact attempt, channel used, consumer response, compliance screening status at time of contact, consent status, dispute hold flags, and outcome. Dashboards generate this automatically and export without reconstruction. Examination prep becomes a query, not a project.
Cost per recovery against recovery rate by channel and aging bucket. Most CFOs track delinquency rate and charge-off rate, both lagging. $3.65 cost per recovery versus $50–$150 traditional, combined with up to 70% recovery on early-stage portfolios, is what positive ROI looks like in this infrastructure.
Yes. RPC, payment commitment rate, and plan completion rate by individual agents sits alongside Autopilot's autonomous recovery performance. You see exactly where human performance is strong, where Copilot guidance is producing lift, and where Autopilot is outperforming, all on the same screen, live.
It enforces FDCPA, TCPA, CFPB Regulation F, and state-specific rules at the point of outreach, not through post-send auditing. Compliance status is visible at portfolio level and drillable to individual accounts, so exposure is caught before it becomes a finding.
Get Central Dashboard for Every Portfolio
Tell us how you track performance today, and we'll show you what real time visibility looks like across your accounts.