
Your A/R aging report isn't a back-office spreadsheet. It's a live readout of how healthy your practice actually is. Most CFOs and practice owners don't find out their collections are broken until the cash flow already has.
Key Takeaways
- Healthy practices keep 75 to 80% of A/R under 30 days and under 10 to 15% past 90 days, and anything worse is a structural problem, not bad luck.
- Days in A/R above 45 is the clearest single signal that collections, not production, is your revenue leak.
- Medical and dental debt made up 58% of all collection tradelines on U.S. credit reports as of Q2 2021, per CFPB analysis. Patient nonpayment is a national-scale financial risk, not a "some patients are difficult" problem.
- A 2017 U.S. Census Bureau survey found 19% of people couldn't fully repay medical bills that year. Affordability, not willingness, is often the real driver of aging balances.
- Insurance A/R and patient A/R age for entirely different reasons and need entirely different playbooks; treating them as one number hides where the actual leak is.
- Manual, generic collections calls are the wrong tool for a problem this data-driven; this is exactly the gap FinanceOps Agentic AI is built to close.
Why A/R Aging Is a CFO Problem, Not a Front-Desk One
Front-desk teams get blamed for aging receivables. That's misdiagnosing the issue. A/R aging is a systems failure: inconsistent follow-up, no segmentation between "can't pay" and "won't pay," and collections timed around staff availability instead of patient behavior. (New to the terminology? Our dental finance glossary breaks down terms like net collection ratio and days in A/R, and our blog covers the operational side of dental revenue cycle management in more depth.)
We'll say it plainly: if your practice is treating A/R follow-up as a task someone does "when there's time," you have already accepted a lower net collection rate than you need to. CFOs overseeing multi-location groups or high-volume SME practices don't have the luxury of hoping the front desk gets to it.
The scale of the underlying problem is bigger than any single practice, too. An internal Consumer Financial Protection Bureau analysis found that as of Q2 2021, medical debt made up 58% of all collection tradelines on U.S. credit reports, versus just 12% for banking and financial debt. Dental balances sit inside that same medical-debt ecosystem, which means the patient-side risk you're managing is a documented, government-tracked phenomenon, not an anecdote. It's also exactly the risk our dental collections solution is built to reduce.
2026 Dental A/R Aging Benchmarks by Bucket
Industry benchmarking data (Dental Economics, MGMA-referenced sources, and dental RCM platforms) converges on a fairly tight range for what "healthy" looks like:
| Aging Bucket | Healthy Benchmark | Red Flag Threshold |
|---|---|---|
| 0 to 30 days | 75 to 80% of total A/R | Below 65% |
| 31 to 60 days | Under 15 to 20% | Above 25% |
| 61 to 90 days | Under 10% | Above 15% |
| 90+ days | Under 10 to 15% | Above 15 to 20% |
| Days in A/R | Under 30 to 40 days | Above 45 days |
| Net collection ratio | 98%+ | Below 95% |
| Patient collection at point of service | 90%+ | Below 80% |
A technical note, because precision matters here: these ranges are compiled across multiple independent industry benchmarking sources that don't define bucket boundaries identically, so treat them as directional guardrails rather than a single dataset that sums to exactly 100%. What matters operationally is the shape of your own distribution over time, not whether you match a published figure to the decimal.
Total A/R itself should hover around 1 to 1.5 times your average monthly production. If your total A/R has ballooned well past that multiple, aging isn't your only problem: you have a structural collections gap. Want to track this yourself first? Grab our free AR aging tracker template.
Insurance A/R and Patient A/R Are Not the Same Problem
This is where most benchmark discussions oversimplify. A blended aging report treats a stalled insurance claim and an unpaid patient balance as the same event. They are not, and collapsing them hides the actual root cause:
- Insurance A/R should turn around in roughly 14 to 21 days. Anything slower usually traces back to coding errors, missing attachments, or unworked claims, not payer bad faith.
- Patient A/R should hit a 95%+ collection rate, ideally with 90%+ collected at or near the point of service. Slower patient collection almost always traces back to affordability or communication failure, not payer processing.
If your total A/R number looks "fine" but you haven't separated these two, you likely have one bucket compensating for the other, and you won't know which one until you split the data.
Red Flags: When Aging AR Signals Real Trouble
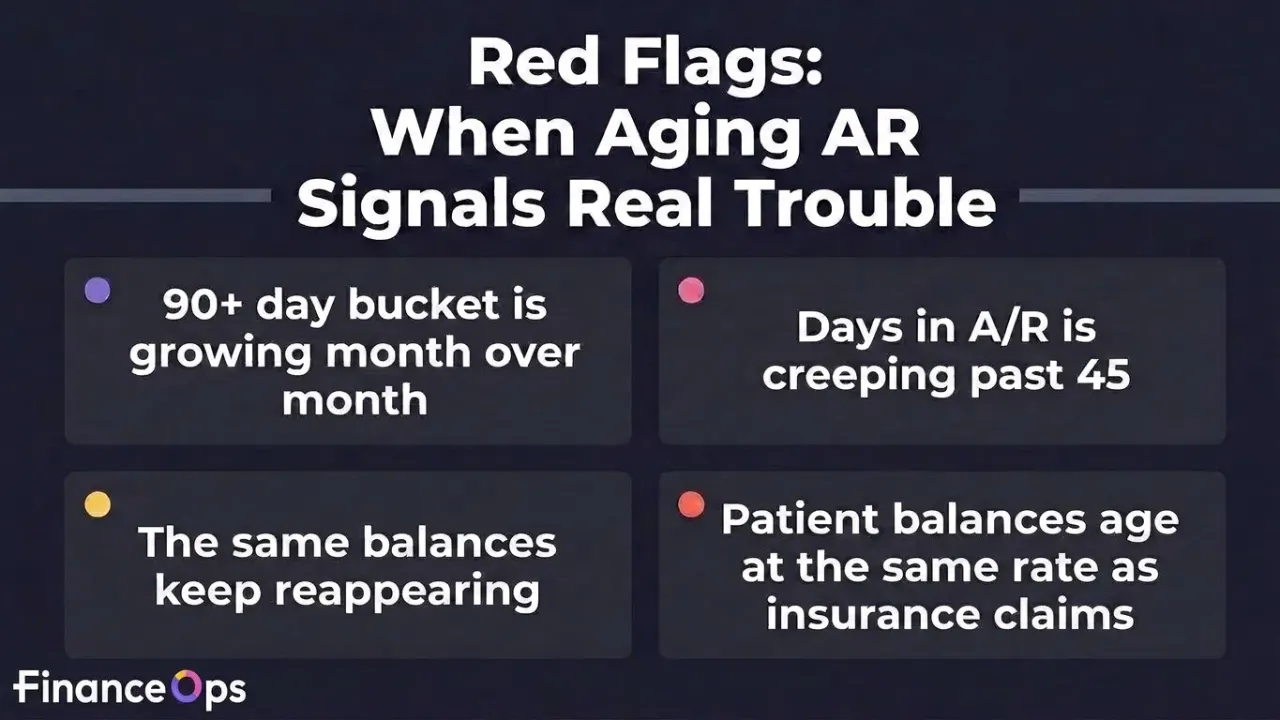
Not every aged balance is a crisis. A single claim stuck at 65 days because of a payer processing delay is normal noise. What separates noise from a real red flag is the pattern:
- Your 90+ day bucket is growing month over month, not shrinking. Balances past 90 days have a documented collection probability as low as 15 to 25%, so growth here is a countdown to write-offs.
- Days in A/R is creeping past 45 even though production is stable. That gap can only be explained by collections execution, not patient volume.
- The same balances keep reappearing on your aging report unresolved. That's a sign no one, human or system, actually owns follow-up past the first attempt.
- Patient balances age at the same rate as insurance claims. These are two entirely different problems requiring different playbooks; if your data can't tell them apart, neither can your collections process.
Our opinion: any practice treating "we'll get to the 90-day bucket next month" as an acceptable answer is quietly financing patient debt out of its own working capital, and calling it normal.
Why Manual Collections Keep Missing These Numbers
Manual and semi-automated collections fail for a predictable reason: they treat every past-due balance the same way, at the same time, through the same channel, regardless of who the patient is or why they haven't paid. A single mother skipping a payment because of affordability needs a completely different approach than a patient who simply forgot. We've written about this gap in more detail on our blog, and the short version is: generic dunning sequences optimize for effort, not for collection probability.
This is where FinanceOps Agentic AI is built specifically for the problem. It's not a generic reminder tool, but a system engineered around the actual behavioral and financial variables that determine whether a balance gets collected.
How FinanceOps Agentic AI Closes the Gap
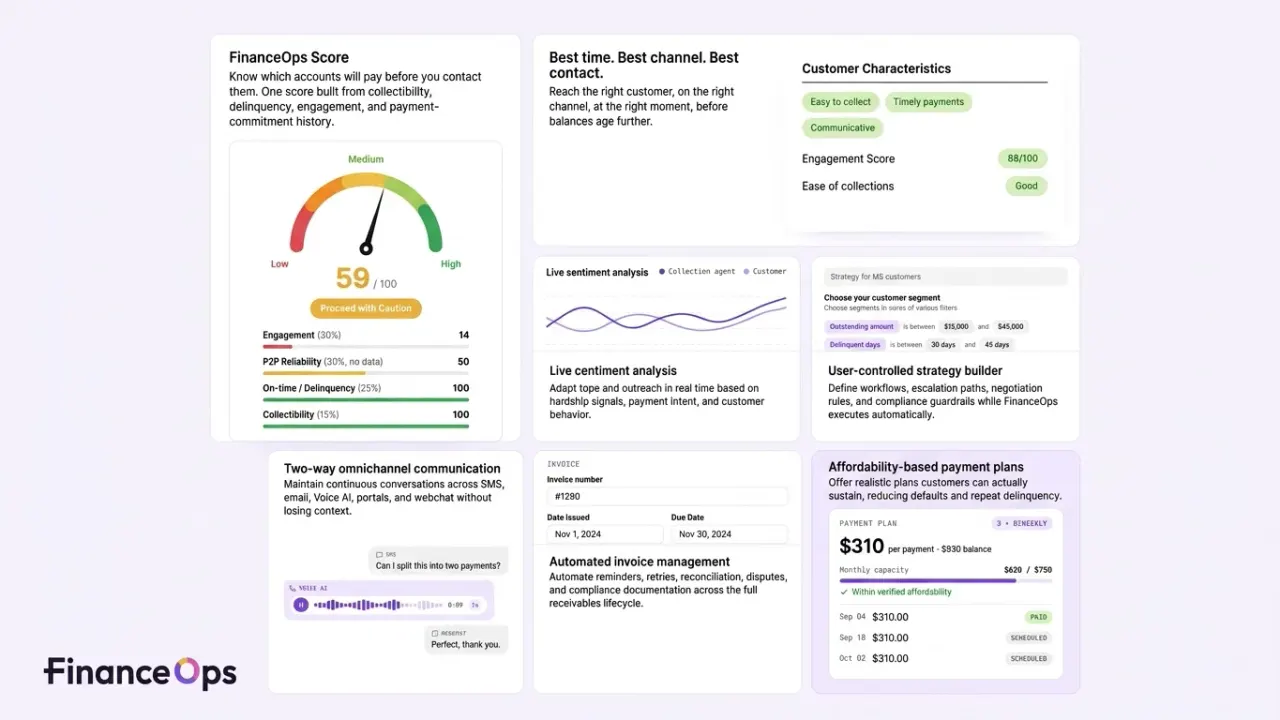
Best Time, Channel & Person to Contact
FinanceOps Agentic AI predicts, per patient, the specific time window, communication channel, and even which staff persona is most likely to get a response, replacing guesswork with a data-backed contact strategy that lifts response rates instead of burning them out.
Live Sentiment Analysis
Every collections and support conversation is scored for sentiment in real time, so escalating frustration or confusion gets flagged and redirected before a recoverable account turns into a lost patient or a complaint.
Affordability-Based Flexible Payment Plans
Instead of one rigid payment plan for everyone, the system models what a patient can realistically afford and proposes plans accordingly, directly addressing the reality that a meaningful share of aging balances are affordability problems, not willingness problems.
Two-Way Omnichannel Multilingual Communication
Patients can respond, ask questions, or negotiate through SMS, email, chat, or voice, in their own language, instead of being talked at through one-way reminders that generate zero engagement.
Automated Invoice Lifecycle
From generation to reminders to reconciliation, invoices move through their full lifecycle without manual handoffs, closing the exact operational gaps that let claims and statements silently age past 30, 60, and 90 days.
User-Controlled Strategy Builder
CFOs and practice owners set the rules: escalation timing, tone, discount thresholds, when a human takes over, so the AI executes your financial policy instead of a black-box default.
FinanceOps Score
A single, continuously updated score rolls up collections health, aging risk, and patient payment behavior into one number CFOs can actually report on, turning "how's collections doing?" into an answerable question instead of a guess. See how the FinanceOps Score is calculated.
The CFO Take: Benchmarks Are a Floor, Not a Goal
Here's our honest position: hitting the "healthy" benchmark ranges above should be the minimum bar, not the ambition. A practice sitting at exactly 80% current and 15% over 90 days is stable, but stable isn't the same as optimized. The practices actually protecting margin in 2026 are the ones using behavioral and financial data to intervene before a balance ages at all, not just tracking it after the fact.
The uncomfortable truth is that most A/R aging reports are diagnostic, not predictive. They tell you a balance is 61 days old after it's already 61 days old. By the time a human reviews the report, prioritizes a worklist, and makes contact, the highest-probability window for collecting that balance has already closed. A benchmark tells you where you stand today. It says nothing about which balances in your current 0 to 30 bucket are about to become tomorrow's 90-day write-offs, and that predictive gap is where real margin is won or lost.
If your current process only tells you that AR is aging and not why, that's the gap worth fixing first, and it's the reason static benchmarks alone will never get a practice past "acceptable" into "optimized."